Azure Portal Metrics Graph / Metric Chart always showing 0 or dips at the end due to averaging.
 If you are a frequent user of the Azure Portal, you might have realized it is a common sighting to see some metrics such as CPU dropping to Zero, Network dipping to Zero, or Disk Read Write Operation drops to Zero.
Do not be alarmed as it is not reflect the true actual value of the service’s metric (which in my case in an Azure VM) dropping to Zero. The charts are an average of the values over time, and does not show real time value as compared to the operating system’s task manager.
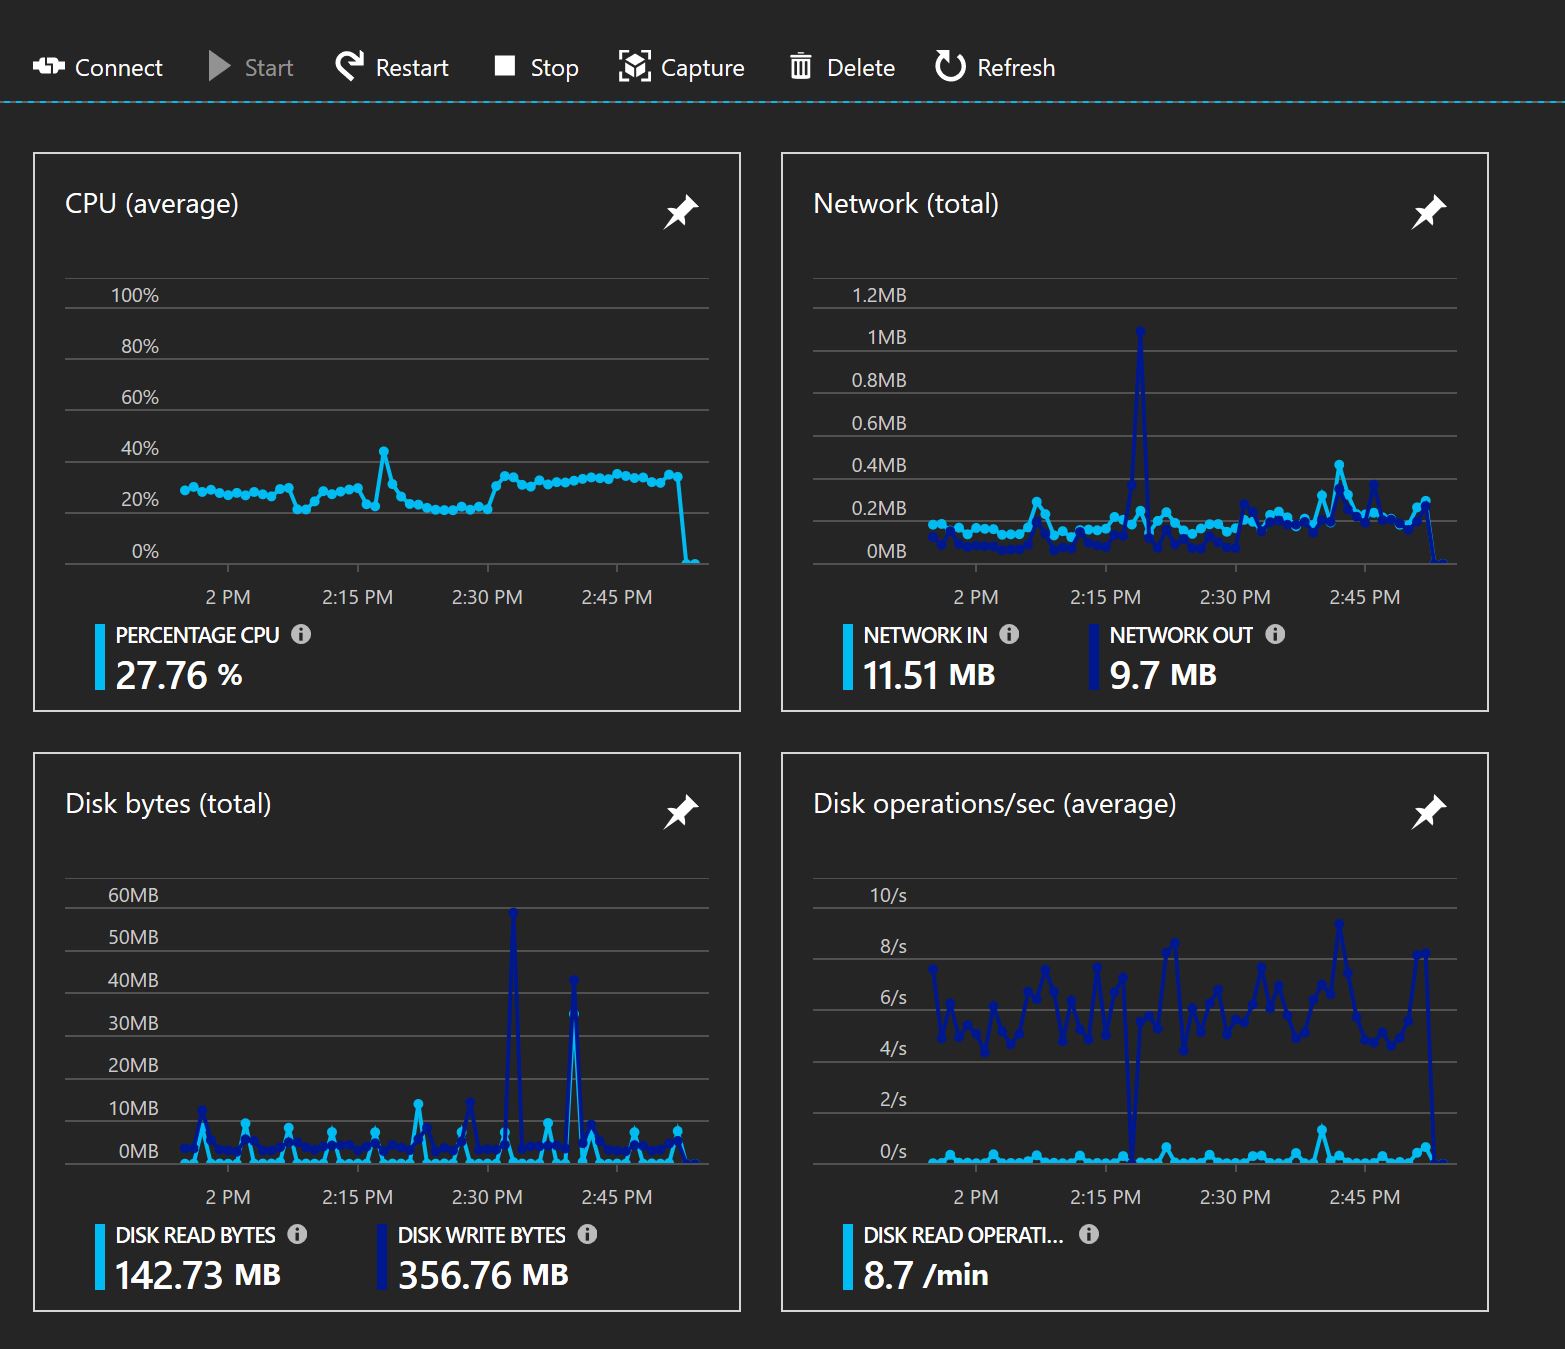
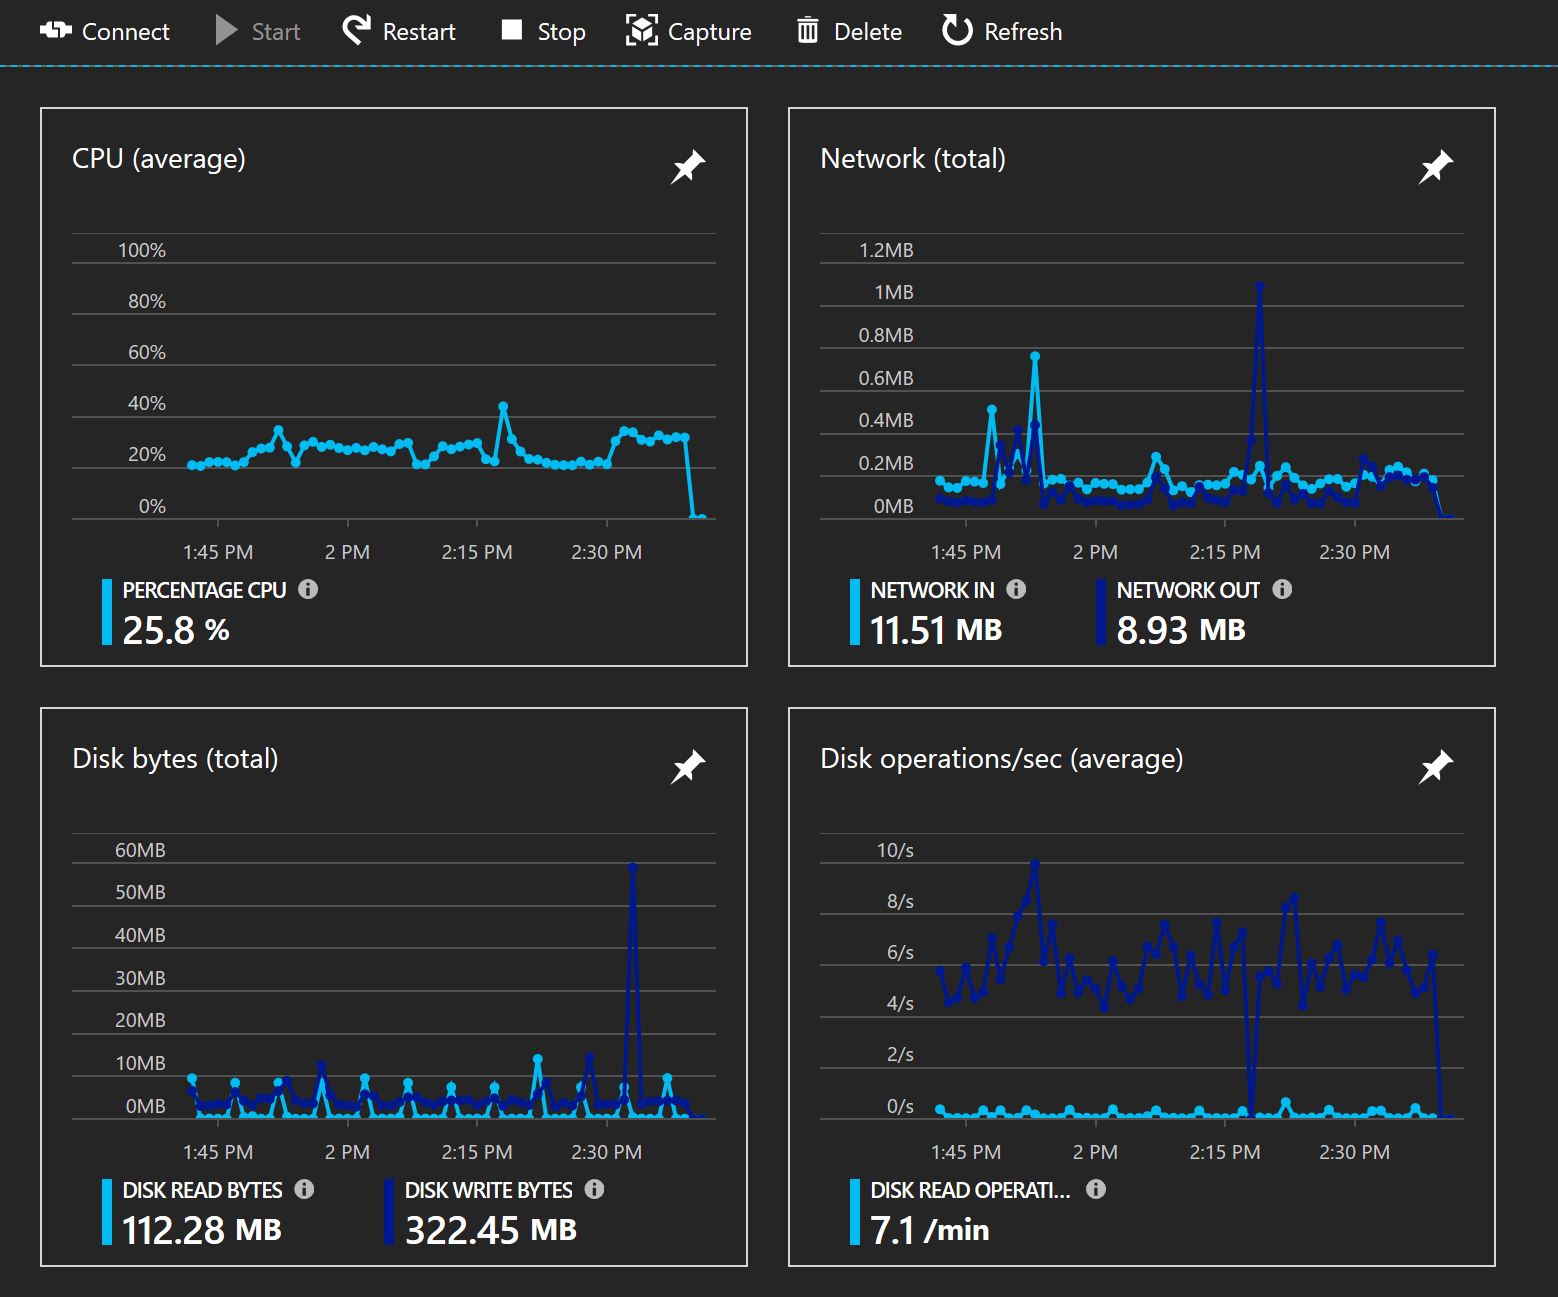
While it shows Zero towards the end of the graph, or dips to zero at the right hand side of the graph, it actually means that that value is still being averaged out.
You should only worry if the dip appears in the middle of the graph for an extended period of time. (small spike down are fine).
Here are 2 graph showing time differences of around 10 mins in between